As we approach the end of the year, I just wanted to say thank you and Happy Holidays! 2024 is going to be a great year and I hope you all have a wonderful New Year!
The stage is set for 2024 to look a lot different from 2023
Quick Take:
The Fed telegraphed that rate hikes are ending, and financial markets expect rate cuts in 2024, which will meaningfully reduce the cost of financing and increase home sales. High mortgage rates continue to drive low home sales, which are down 15% year over year. However, low sales have caused inventory to build, which will benefit the 2024 market as demand increases. Home prices are declining slightly, which is normal this time of year, but mortgage rates are keeping the monthly cost of financing a home at or near record highs.
Note: You can find the charts & graphs for the Big Story at the end of the following section.
The 2024 housing market may not be flaming hot like in 2021, but it’ll definitely be a little spicy
Even though Fed Chair Jerome Powell remarked that it’s too soon to definitively conclude that rate hikes are finished, the financial markets have, in fact, decided they’re finished. As of December 4, 2023, interest-rate futures traders (the people who make a lot of money being right about where rates will go) expect the Fed to cut the federal funds rate, which currently falls between 5.25% and 5.50%, by 1.25%.
As a quick recap, the Fed dropped the fed funds rate effectively to 0% at the start of the pandemic and purchased mortgage-backed securities. The already historically low average 30-year mortgage rate then fell even further, reaching a record low of 2.65% in early 2021, which fueled the housing boom from June 2020 to June 2022. Inflation spiked in 2021, hitting levels not seen since the early 1980s and causing the Fed to begin rate hikes in March 2022, which trickled through markets quickly. From the beginning to the end of 2022, mortgage rates more than doubled, ending the white hot housing market and creating the slow-paced 2023 market. Mortgage rates continued to rise in 2023, hitting a 23-year high of 7.79% in October. Luckily, the average 30-year mortgage rate contracted in November 2023, falling to 7.22% by the end of the month.
It’s hard to convey the full significance of higher mortgage rates on the housing market but, in short, they are the primary driver of the market slowdown. This is evidenced by the fact that the market began slowing down at almost the exact same time that the Fed began their rate hikes. In October 2023, a buyer’s monthly cost reached an all-time high when accounting for the cost of financing a mortgage. Redfin reported the highest rate of buyers backing out of home purchases on record, as home buyers experienced the sticker shock of the cost to finance the home. It should come as no surprise that sales continued to fall and will likely continue to decline through the winter months.
Now, back to our outlook for the year ahead. The falling sales in 2023 have allowed inventory to grow, which is much needed. Although inventory is still down 6% year over year, it has increased 20% in 2023 and will likely continue to increase through the rest of the year, which is far different from the typical seasonal trend of increasing in the first half of the year and declining in the second. In Q1 2024, we expect inventory to rise further, helping ease the low supply problem. Greater supply will be necessary because mortgage rates should decrease meaningfully with the anticipated rate cuts, driving up demand. A 1% decrease in interest rate equates to a 10% decrease in monthly financing costs. At this point, we expect a large number of would-be buyers to wait a little longer to gain more clarity around rate cuts in 2024 and hit the market in the spring and summer months.
Different regions and individual houses vary from the broad national trends, so we’ve included a Local Lowdown below to provide you with in-depth coverage for your area. In general, higher-priced regions (the West and Northeast) have been hit harder by mortgage rate hikes than less expensive markets (the South and Midwest) because of the absolute dollar cost of the rate hikes and limited ability to build new homes. The National Association of Realtors’ Chief Economist Lawrence Yun recently remarked that multiple offers are still occurring, especially on starter and mid-priced homes, even as price concessions are happening in the upper end of the market. As always, we will continue to monitor the housing and economic markets to best guide you in buying or selling your home.
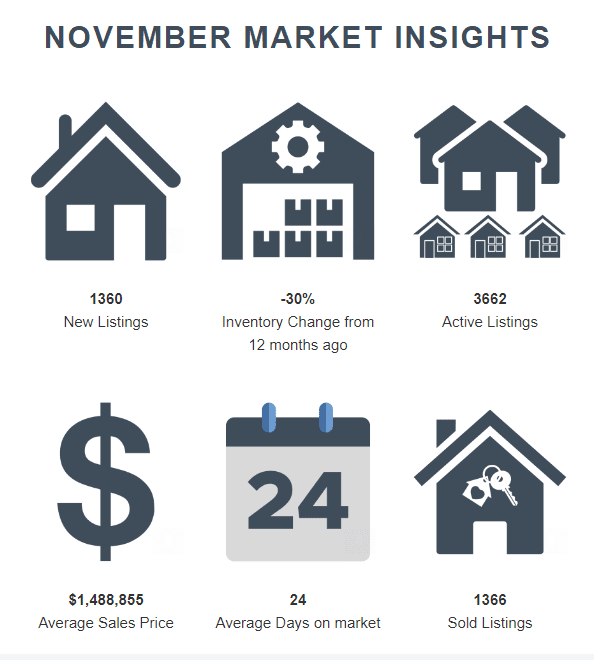
The median single-family home price increased 1.0% from October to November, while condo prices increased slightly, up 0.1%. Both single-family home and condo prices are just below the all-time highs, down 1.9% and 2.7%, respectively.
Active listings in Orange County fell month over month, continuing the 15-month downward trend. Inventory will likely hit a record low next month as new listings continue to fall.
Months of Supply Inventory declined in November as sales declined at a slower rate than inventory and new listings, indicating a strong sellers’ market. It’s typical for the market to become more balanced in the fall and winter, with fewer buyers participating, but atypical supply patterns have created atypical demand patterns as well.
Note: You can find the charts/graphs for the Local Lowdown at the end of this section.
In Orange County, the home prices seem to be impervious to rising mortgage rates, even hitting all-time highs in August 2023 for condos and September 2023 for single-family homes. In November, the median single-family home and condo prices were 1.9% and 2.7% below their peaks, respectively, but slight price contractions are normal in the second half of the year. We expect prices to remain slightly below peak in the winter months, but as interest rates decline, prices will almost certainly reach new highs in the first half of 2024. Additionally, the sustained downward inventory trend and low number of new listings will only raise prices as demand grows. However, more homes must come to the market in the spring and summer to get anything close to a healthy market.
High mortgage rates soften both supply and demand, so ideally, as rates fall, far more sellers will come to the market. Rising demand can only do so much for the market if there isn’t supply to meet it. Unlike 2023, 2024 inventory has a much better chance of following more typical seasonal patterns.
Inventory continues 15-month downward trend, nearing record
Single-family home and condo inventory have trended lower over the past 15 months, which is far from the seasonal norm. Typically, inventory peaks in July or August and declines through December or January. In 2023, inventory didn’t have anything resembling the typical sine wave, since far fewer sellers came to the market, especially in the first half of the year. With inventory near historic lows, the number of new listings coming to market is a significant predictor of sales. Month over month, new listings fell 26% and sales declined 10%. Year over year, however, sales are up 3%, and new listings are down 10%. Considering active listings are down 30% year over year, the increase in sales highlights the impressive desirability of Orange County.
As demand slows, buyers are gaining more negotiating power and paying slightly less than asking price on average. In July 2023, the average seller received 100% of list price, compared to 97% of list in November. Inventory will almost certainly remain historically low for the next few months, and buyer competition will ramp up meaningfully in the spring, which will create price support.
Months of Supply Inventory continues to indicate a strong sellers’ market
Months of Supply Inventory (MSI) quantifies the supply/demand relationship by measuring how many months it would take for all current homes listed on the market to sell at the current rate of sales. The long-term average MSI is around three months in California, which indicates a balanced market. An MSI lower than three indicates that there are more buyers than sellers on the market (meaning it’s a sellers’ market), while a higher MSI indicates there are more sellers than buyers (meaning it’s a buyers’ market). MSI fell below three months in the first quarter this year, and it has hovered around two months of supply from March through November. Currently, MSI indicates the housing market in Orange County continues to favor sellers.
Explore the places, neighborhoods, and people that make the communities we serve special. We’ve highlighted important market data, school information, and neighborhood highlights to help you find your new home.